10 Engineering Performance Review Best Practices That Actually Work in 2026
Here is a sobering statistic: 95% of HR leaders are dissatisfied with their current performance management systems, yet 71% of companies still cling to annual reviews as their primary evaluation method. In the world of software engineering, where code ships daily and sprints last two weeks, waiting twelve months to give feedback is not just outdated—it is actively harmful to team performance.
This article cuts through the noise. I have analyzed data from Google’s 2025 DORA report (surveying nearly 5,000 technology professionals), Gallup’s extensive research on employee engagement, and real-world case studies from companies like Adobe, Deloitte, and Microsoft that have abandoned traditional reviews. What emerges is a clear picture: engineering teams that adopt continuous feedback frameworks, measure the right metrics, and separate coaching from compensation decisions see dramatic improvements in retention, productivity, and code quality.
Why Traditional Performance Reviews Fail Engineering Teams
Before diving into what works, we need to understand why the old model breaks down. Annual performance reviews were designed for industrial-era workplaces where tasks were repetitive and skills changed slowly. Software engineering operates on entirely different principles.
The research is damning. According to a comprehensive TechClass analysis published in 2025, 55% of workers say annual reviews do not improve their performance, and just 13% of employees and managers find them useful. For engineering teams specifically, the problems compound:
Recency bias distorts evaluations. Managers naturally overweight recent events when evaluating a full year of work. That brilliant architecture decision from March gets forgotten, while the minor bug from last week looms large. Engineers feel this unfairness acutely—they know their best work happened earlier in the cycle, but the review does not reflect it.
Annual cycles mismatch engineering velocity. Modern engineering teams deploy multiple times per day. Requirements shift quarterly. New technologies emerge monthly. A goal set in January is often irrelevant by June. Waiting until December to adjust objectives means engineers spend half the year working toward outdated targets.
The stress undermines psychological safety. Nearly 75% of millennial engineers report feeling unsure about their performance after traditional appraisals, and 62% say they have been blindsided by review content. This creates a defensive posture where engineers optimize for looking good in reviews rather than taking risks or innovating.
Manager time gets wasted. A 2025 study found that managers spend an average of 210 hours per year preparing annual performance reviews. That is more than five full work weeks spent on documentation, calibration meetings, and form-filling—time that could go toward actual coaching, code reviews, or removing blockers for their teams.
Adobe saw these problems firsthand. Before 2012, their annual review process consumed 80,000 manager hours annually—equivalent to 40 full-time employees. Worse, voluntary turnover spiked every January after reviews. Something had to change.
The DORA Metrics: What Elite Engineering Teams Measure
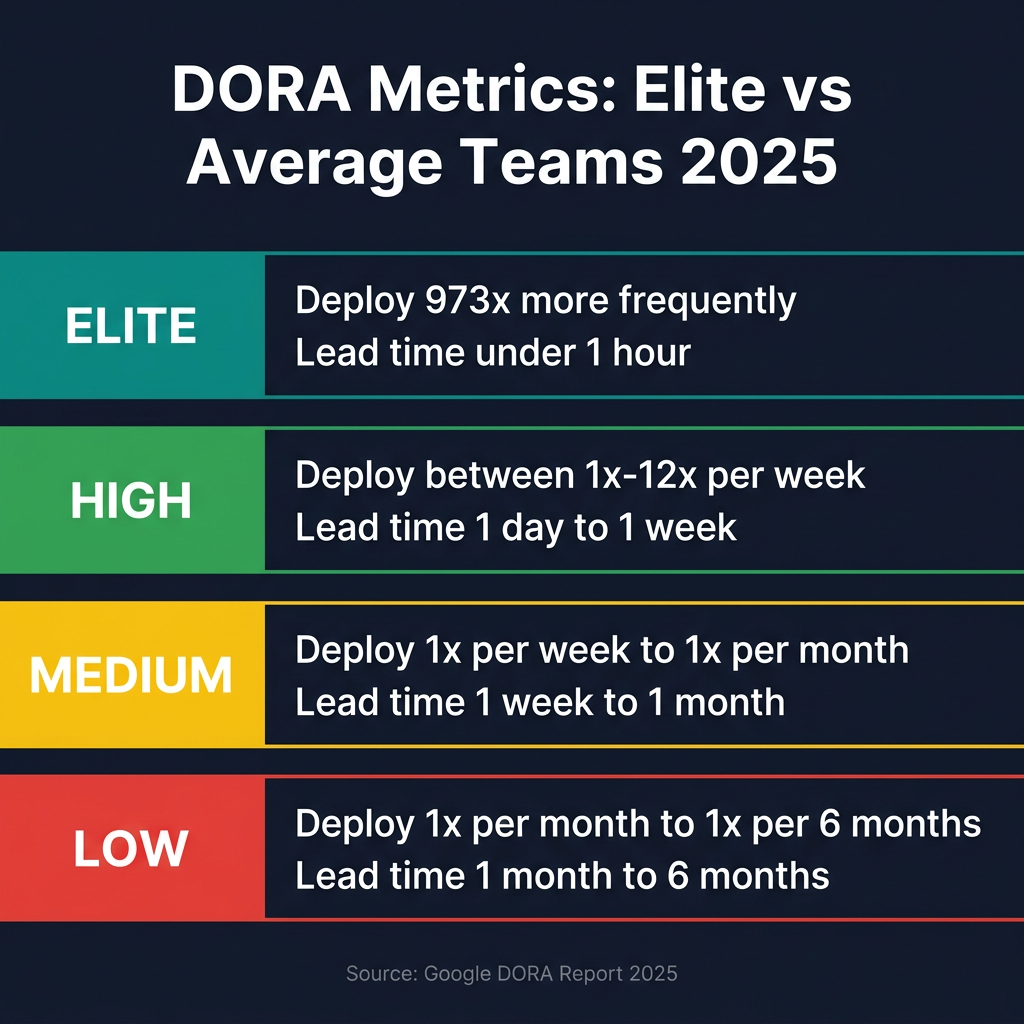
Google’s DevOps Research and Assessment (DORA) team has spent over a decade studying what makes software teams effective. Their 2025 report, “State of AI-assisted Software Development,” introduces a fifth metric while reinforcing the validity of the original four. These are not vanity metrics—they predict organizational performance.
| DORA Metric | Elite Performers | High Performers | Medium Performers | Low Performers |
|---|---|---|---|---|
| Deployment Frequency | Multiple times daily | Between once per day and once per week | Between once per week and once per month | Between once per month and once every 6 months |
| Lead Time for Changes | Less than 1 hour | Between 1 day and 1 week | Between 1 week and 1 month | Between 1 month and 6 months |
| Change Failure Rate | Less than 5% | 5-15% | 16-30% | Greater than 30% |
| Failed Deployment Recovery | Less than 1 hour | Less than 1 day | Less than 1 week | Between 1 week and 1 month |
| Rework Rate (New 2025) | Less than 10% | 10-20% | 21-35% | Greater than 35% |
The 2025 data reveals something striking: elite performers deploy code 973 times more frequently than low performers, with lead times under one hour compared to six months. These are not incremental differences—they represent fundamentally different organizational capabilities.
The new fifth metric, rework rate, measures unplanned deployments requiring immediate fixes. DORA added this because AI coding tools have changed the game. With 90% of developers now using AI assistants, teams ship faster—but not always better. Rework rate captures the hidden cost of speed without quality. Teams with high rework rates are essentially running in circles: deploy, fix, redeploy, fix again.
Here is how to use these metrics in performance reviews:
Measure team trends, not individual blame. DORA metrics work best at the team level. Individual developer metrics like “lines of code” or “commits per day” create perverse incentives. Instead, track whether the team’s deployment frequency is improving quarter over quarter. Is lead time decreasing? Is change failure rate stable or dropping?
Pair throughput with stability metrics. A team that deploys 50 times per day but breaks production twice weekly is not high-performing—they are reckless. Always view deployment frequency alongside change failure rate and rework rate. Elite teams excel at both speed and stability.
Account for AI tooling effects. The 2025 DORA report found AI acts as a “mirror and multiplier”—it amplifies whatever your team already does well. If your processes are solid, AI accelerates you. If they are broken, AI accelerates the breakage. When reviewing performance, ask: are we deploying more because our pipeline improved, or because AI lets us skip steps? The metrics will tell you.
The SPACE Framework: Measuring What DORA Misses
DORA metrics tell you how fast code moves through your pipeline. They do not tell you whether your developers are happy, collaborating effectively, or working sustainably. That is where the SPACE Framework comes in.
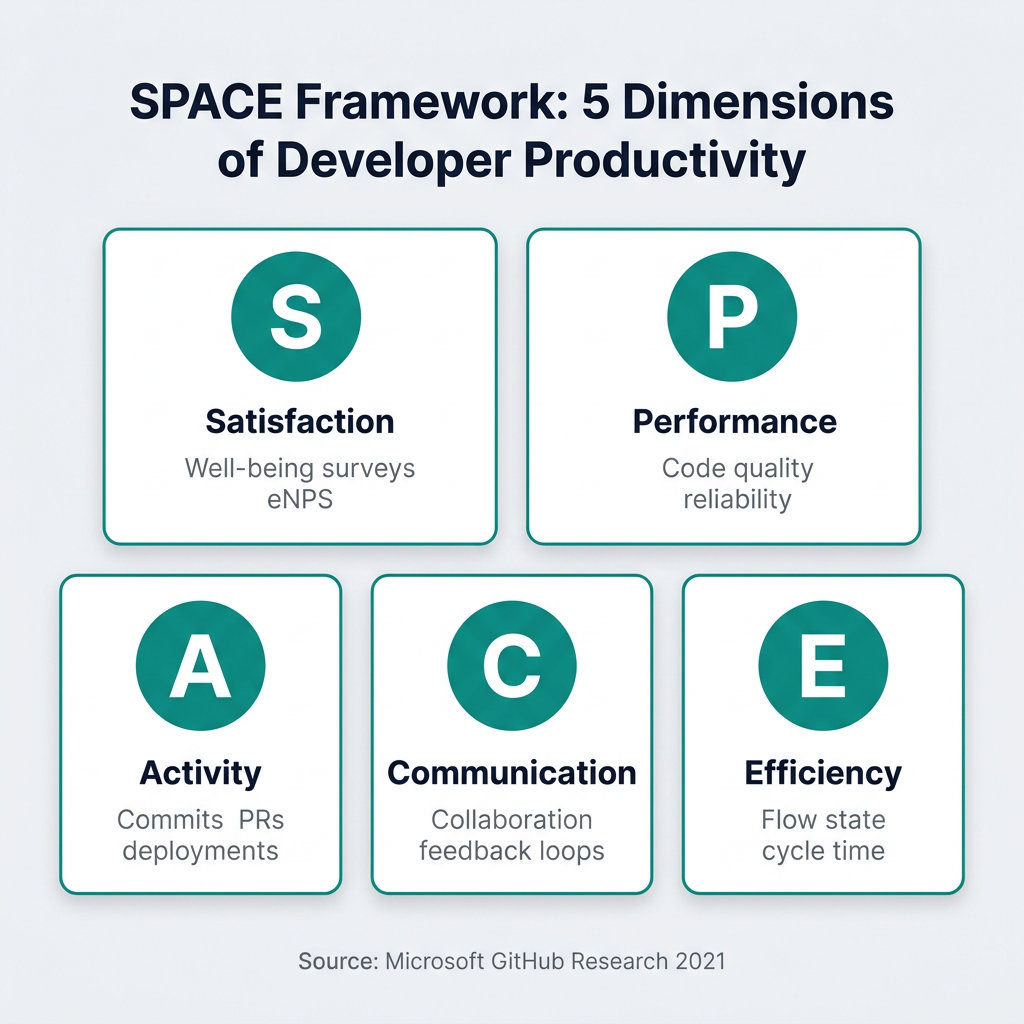
Developed by researchers from Microsoft, GitHub, and Victoria University and published in ACM Queue in 2021, SPACE provides five dimensions for understanding developer productivity:
Satisfaction and Well-being captures how developers feel about their work. High satisfaction correlates with better retention and code quality. Measure this through quarterly eNPS (employee Net Promoter Score) surveys, PTO utilization patterns, and 1:1 check-ins. Burnout is a leading indicator of attrition—track it before people quit.
Performance measures output quality, not just quantity. This includes code review quality, defect rates, system reliability, and customer-reported issues. Unlike activity metrics, performance metrics connect engineering work to business outcomes.
Activity tracks what developers do day-to-day: commits, pull requests, code reviews, documentation updates. These metrics require careful interpretation. High activity can indicate productivity—or thrashing, context-switching, and technical debt accumulation. Never use activity metrics alone.
Communication and Collaboration measures how effectively information flows. Track PR review turnaround times, cross-team meeting patterns, and documentation quality. Engineering is a team sport; siloed developers create integration nightmares.
Efficiency and Flow captures how smoothly work progresses. Cycle time (from first commit to production deployment), wait times in queues, and interruption frequency all matter. Developers in flow state are 5x more productive than those constantly context-switching.
The key insight from SPACE: no single metric tells the whole story. A developer with low commit activity might be doing deep architectural work that prevents future outages. A team with high deployment frequency might be burning out. You need the full picture.
Practice 1: Replace Annual Reviews with Continuous Check-ins
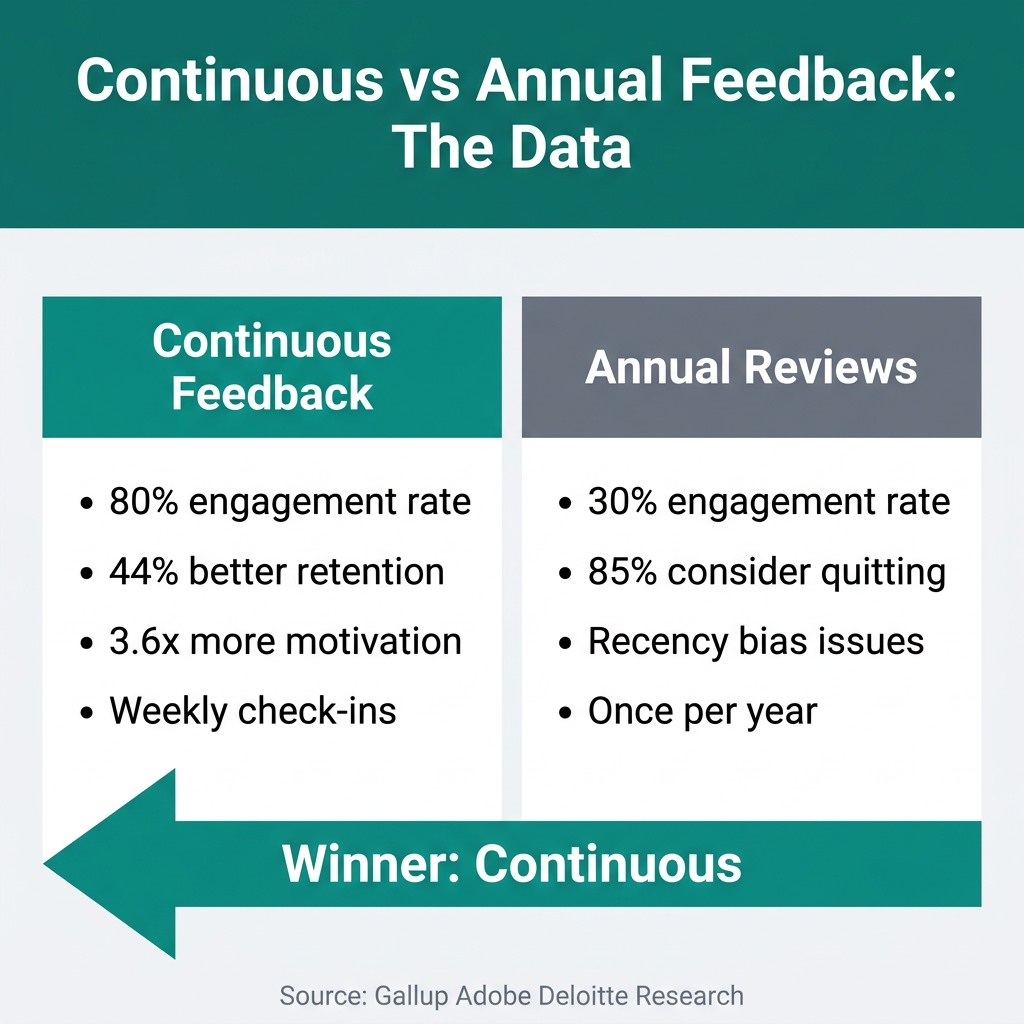
Adobe made headlines in 2012 when they abolished annual performance reviews entirely. In their place, they implemented “Check-ins”—frequent, lightweight conversations between managers and employees. The results were dramatic: 30% reduction in voluntary turnover, elimination of 80,000 hours of managerial paperwork, and higher engagement scores across the board.
The model is simple:
Weekly 15-minute pulse checks. These are not formal reviews—they are quick conversations about priorities, blockers, and support needs. What is getting in your way? What do you need from me? These questions surface issues while they are still small.
Monthly 30-minute development discussions. Go deeper on skill growth, career trajectory, and project learnings. What did you learn from that outage? What skills do you want to build next quarter? These conversations focus on growth, not evaluation.
Quarterly goal alignment sessions. Review objectives, adjust for changing business priorities, and ensure individual goals still map to team outcomes. This replaces the annual goal-setting ritual with something actually useful.
The data supports this approach. Gallup research shows that 80% of employees who receive meaningful feedback weekly are fully engaged, compared to just 30% global average. Engineers who get daily feedback are 3.6 times more likely to be motivated to do outstanding work versus those receiving annual feedback.
Reclaim.ai’s 2025 productivity report adds another layer: more than 40% of one-on-one meetings are rescheduled weekly, taking over 10 minutes each to coordinate. The solution is not fewer meetings—it is predictable, protected calendar time. Treat check-ins as immovable appointments. When managers consistently cancel 1:1s, engineers interpret it as a signal that their development does not matter.
Practice 2: Separate Coaching Conversations from Compensation Decisions
This is the most important—and most violated—principle of effective performance management. When feedback directly determines raises and bonuses, honesty dies.
Engineers learn to optimize for the evaluation rather than the outcome. They hide mistakes, avoid risky projects, and manage impressions rather than code quality. Managers, meanwhile, sandbag ratings to preserve their budget or inflate scores to retain talent. The result is theater, not development.
The solution is structural separation:
Continuous feedback focuses exclusively on growth. These conversations cover what is working, what needs improvement, and how to get there. No ratings, no rankings, no compensation discussion. Just coaching.
Compensation decisions happen separately, ideally through a calibration process that considers market data, company performance, and contribution over time—not just a single manager’s opinion.
Microsoft learned this lesson the hard way. Their old “stack ranking” system forced managers to grade engineers on a curve, creating cutthroat internal competition. Top performers hoarded information. Collaboration died. After abolishing stack ranks in 2013, Microsoft saw cultural transformation that contributed to their resurgence.
Deloitte took a similar path. After finding that their performance management process consumed 2 million hours annually with minimal impact, they redesigned around frequent check-ins. Managers now spend time coaching instead of filling forms—and performance improved.
Practice 3: Measure Team Performance, Not Individual Output
Individual developer metrics are seductive and dangerous. Lines of code, commits per day, and story points completed all seem objective. They are also easily gamed and fundamentally misaligned with how software engineering works.
Consider two engineers. One writes 500 lines of code that introduce a critical bug requiring weeks to fix. Another deletes 200 lines, simplifying the codebase and eliminating an entire class of errors. Who performed better? The individual metrics say the first engineer. Reality says the second.
Or take code review. Engineer A approves PRs instantly, racking up high review counts. Engineer B asks hard questions, catches architectural flaws, and pushes for better tests. Their review count is lower, but their impact is higher. Individual metrics cannot capture this.
The DORA research is explicit: these metrics measure team performance, not individual performance. Deployment frequency, lead time, change failure rate—these are properties of systems, not people. A team’s deployment frequency reflects CI/CD maturity, test coverage, code review practices, and release automation. No single engineer controls all of those.
What to do instead:
Evaluate team health metrics. Is the team deploying regularly? Is lead time stable or improving? Are incidents decreasing? These indicate whether the team is building sustainable engineering practices.
Assess collaboration quality. How quickly do PRs get reviewed? How often do engineers pair program or share knowledge? High-performing teams have strong information flow.
Review project outcomes, not activity. Did the team deliver the re-architecture on time? Is the new service meeting reliability targets? Outcomes matter more than hours logged.
This does not mean individual contribution is invisible. In 1:1s, managers discuss specific behaviors, technical decisions, and growth areas. But these conversations are qualitative and developmental—not quantitative and evaluative.
Practice 4: Use 360-Degree Feedback for Development, Not Evaluation
360-degree feedback—input from peers, subordinates, and other stakeholders—provides valuable perspective. Used poorly, it creates political bloodbaths. Used well, it accelerates growth.
The key distinction: 360 feedback should be developmental, not evaluative. When peer feedback determines promotions or compensation, relationships become transactional. When it informs self-awareness and skill building, relationships become supportive.
Best practices for engineering teams:
Keep feedback anonymous but constructive. Engineers need to feel safe giving honest input about colleagues. Anonymous surveys enable this—but require careful framing to prevent gratuitous criticism.
Focus on observable behaviors, not personality. “You interrupt others in architecture discussions” is actionable. “You are arrogant” is not. Train engineers to give specific, behavior-based feedback.
Limit scope to growth areas. A 360 review that covers 50 competencies produces noise. Focus on 2-3 development priorities agreed upon in advance.
Never use 360 data for ranking or compensation. Once peer feedback affects pay, it becomes unreliable. Engineers rate friends higher, rivals lower. The signal becomes political, not developmental.
Research from Leapsome and other performance management platforms shows that 360 feedback is most effective when integrated into continuous feedback cultures—not annual rituals. Regular peer input, given in real time, is more useful than a once-yearly summary.
Practice 5: Set OKRs That Engineers Actually Care About
Objectives and Key Results (OKRs) have become standard in tech companies, but implementation varies wildly. Bad OKRs demotivate. Good OKRs align.
The OKR software market reflects this importance: valued at $1.51 billion in 2025, it is projected to reach $5.15 billion by 2034 (14.6% CAGR). Companies are investing heavily in goal-setting infrastructure—but the framework matters less than the execution.
Common OKR failures in engineering:
Top-down mandates without input. When executives set engineering OKRs without consulting the teams who will execute them, you get compliance, not commitment. Engineers check boxes rather than solve problems.
Activity-based key results. “Ship 10 features” or “Close 50 tickets” measure busyness, not value. Better: “Reduce API latency by 40%” or “Achieve 99.99% uptime for payment processing.” Key results should measure outcomes, not output.
Static annual objectives. Technology changes fast. An objective set in January may be irrelevant by March. OKRs need quarterly refresh cycles to stay meaningful.
Too many objectives. Five objectives with four key results each creates 20 targets. Human attention fragments. High-performing engineering teams focus on 1-2 critical objectives per quarter.
Effective engineering OKRs connect to business impact:
| Poor OKR | Effective OKR |
|---|---|
| Objective: Improve code quality Key Result: Write more unit tests |
Objective: Reduce production incidents Key Result: Achieve 95% test coverage on payment service |
| Objective: Ship faster Key Result: Deploy 100 times |
Objective: Accelerate customer feedback loops Key Result: Reduce lead time from commit to production under 4 hours |
| Objective: Build new features Key Result: Complete 20 story points |
Objective: Increase user engagement Key Result: Launch recommendation engine increasing session duration 15% |
The difference: effective OKRs specify the “why” (business outcome) and the “what” (measurable result). Poor OKRs specify activity without purpose.
Practice 6: Track Leading Indicators, Not Just Lagging Metrics
Most performance reviews focus on lagging indicators: revenue shipped, bugs fixed, features delivered. These tell you what happened. They do not help you change what will happen.
Leading indicators predict future performance. For engineering teams, these include:
Code review turnaround time. Slow reviews block flow. If PRs sit unreviewed for days, predictability suffers. Elite teams review code within hours, not days.
Work in progress (WIP) limits. Too many concurrent tasks create context-switching overhead. Track how many tickets each engineer has in flight. High WIP predicts delays and quality issues.
Meeting load and focus time. Reclaim.ai’s research shows engineers with 15+ weekly meetings work 74 extra minutes daily just to accommodate them. Calendar analytics predict burnout before it happens.
Technical debt ratio. What percentage of sprint capacity goes to maintenance versus new features? Rising debt ratios predict future velocity collapse.
Onboarding time. How long until new hires ship meaningful code? Increasing onboarding time signals documentation decay or architectural complexity.
Smart performance reviews discuss these leading indicators. “I notice your PR review time has increased from 4 hours to 2 days. What is blocking you?” This conversation prevents future delivery problems rather than just documenting past ones.
Practice 7: Make Feedback Specific, Timely, and Actionable
Vague feedback helps no one. “You need to be more proactive” or “improve your communication” leaves engineers guessing what to actually do.
The SBI model (Situation-Behavior-Impact) provides a better framework:
Situation: Context for when the behavior occurred. “In yesterday’s architecture review…”
Behavior: Observable action, not interpretation. “…you dismissed the junior engineer’s suggestion without asking clarifying questions.”
Impact: Consequence of the behavior. “…they stopped contributing for the rest of the meeting, and we may have missed a valid concern.”
Compare: “You are dismissive of others” (vague, personal) versus “In yesterday’s architecture review, you dismissed the junior engineer’s suggestion without asking clarifying questions. They stopped contributing for the rest of the meeting, and we may have missed a valid concern” (specific, behavioral, actionable).
Timeliness matters as much as specificity. Feedback given within 24 hours of an event is 4x more effective than feedback given weeks later. The behavior is fresh. The context is clear. The engineer can adjust immediately.
Radical Candor—caring personally while challenging directly—provides another useful framework. Engineers need to know their manager genuinely cares about their success. Without that foundation, critical feedback feels like attack. With it, feedback feels like investment.
Practice 8: Calibrate Across Teams to Ensure Fairness
Inconsistent standards create inequity. A “meets expectations” rating from one manager might equal “exceeds expectations” from another. Engineers talk. They compare. Perceived unfairness destroys trust.
Calibration sessions—where managers discuss and align ratings across teams—address this. But they must be done carefully:
Focus on behaviors and outcomes, not personalities. “This engineer led the migration that reduced infrastructure costs 30%” is defensible. “This engineer is a rock star” is not.
Use consistent evidence. What specific work supports each rating? Vague assertions get challenged. Concrete examples create alignment.
Watch for bias patterns. Do remote engineers get lower ratings? Do women get coded as “helpful” while men get coded as “strategic”? Calibration is an opportunity to surface and correct systemic bias.
Separate performance from potential. Some engineers deliver excellent work but have limited growth trajectory. Others are still learning but show massive upside. Conflating these creates confusion.
Deloitte’s research found that calibration sessions were one of the most time-consuming parts of their old performance management process—and one of the least valuable. After redesigning around continuous feedback, they eliminated formal ratings entirely, replacing calibration with ongoing manager alignment. The result: less bureaucracy, more fairness.
Practice 9: Invest in Manager Training for Difficult Conversations
Most engineering managers are promoted for technical excellence, not people skills. They know how to optimize databases, not how to tell an engineer their performance is not meeting expectations.
This skill gap has consequences. A 2025 Gallup study found that 40% of U.S. workers become actively disengaged when they receive little or no feedback. But poorly delivered feedback can be worse than no feedback—it creates resentment and defensiveness.
Engineering managers need training in:
Delivering critical feedback constructively. The SBI model, Radical Candor, and other frameworks provide structure. But frameworks are not enough—managers need practice through role-play and coaching.
Coaching versus telling. High-performing engineers do not need managers to solve their technical problems. They need managers to ask questions that help them solve problems themselves. “What have you tried?” “What would you do if you knew you could not fail?” These coaching questions develop autonomy.
Recognizing burnout signals. Declining engagement, increased cynicism, reduced efficacy—these are burnout warning signs. Managers need to spot them early and intervene.
Discussing career development. Engineers want to know their growth path. Can they advance technically without becoming managers? What skills should they build? Managers need answers—or at least frameworks for exploring these questions.
Adobe invested heavily in manager training when they moved to continuous feedback. They found that managers who were effective at annual reviews often struggled with frequent check-ins. The skills are different. The investment paid off: their 30% turnover reduction came partly from better manager-engineer relationships.
Practice 10: Use AI-Assisted Tools Wisely—Not as a Replacement for Judgment
The 2025 DORA report found that 90% of developers now use AI tools, spending around two hours daily with them. AI is reshaping performance measurement—but not replacing human judgment.
AI can help with:
Pattern detection in metrics. Tools like Plandek’s “Dekka” AI assistant analyze DORA metrics and flag anomalies. “Your cycle time increased 40% this sprint. Here are the likely causes.” This augments manager insight.
Automating routine feedback collection. AI can summarize peer feedback, track goal progress, and suggest discussion topics for 1:1s. This reduces administrative burden.
Predicting burnout risk. Calendar analysis, commit patterns, and communication metadata can flag engineers who may be struggling—before they quit.
But AI has limits:
It cannot evaluate code quality. AI can measure activity, not impact. A developer who deletes code to simplify systems looks less active by raw metrics—but may be your highest performer.
It misses context. An engineer’s deployment frequency dropped because they were mentoring three new hires. AI flags the metric. Human judgment understands the trade-off.
It amplifies existing biases. If your historical data reflects biased promotion decisions, AI will learn those patterns and perpetuate them.
The DORA research warns of the “mirror and multiplier” effect: AI amplifies whatever your team already does. If you have strong feedback cultures and fair evaluation practices, AI makes them more efficient. If you have weak practices, AI makes them more efficient at being bad.
Use AI for data gathering and pattern detection. Keep humans in the loop for interpretation, coaching, and decisions.
Key Takeaways
- Annual reviews are failing engineering teams: 95% of HR leaders are dissatisfied, 55% of workers say they do not improve performance, and they create recency bias while consuming 210 manager hours annually.
- Elite teams deploy 973x more frequently than low performers: DORA metrics provide objective benchmarks for deployment frequency, lead time, change failure rate, recovery time, and the new 2025 rework rate metric.
- The SPACE Framework captures what DORA misses: Satisfaction, Performance, Activity, Communication, and Efficiency dimensions provide holistic visibility into developer productivity and well-being.
- Continuous feedback outperforms annual reviews: 80% of employees receiving weekly feedback are fully engaged versus 30% global average, and companies see 44% better retention with continuous feedback cultures.
- Separate coaching from compensation: When feedback directly determines pay, honesty dies. Structural separation enables genuine developmental conversations.
- Measure team performance, not individual output: Lines of code and commit counts create perverse incentives. DORA metrics work at the team level.
- Use 360 feedback for development only: Anonymous peer input accelerates growth when developmental. It becomes political when evaluative.
- Set outcome-based OKRs: Key results should measure business impact, not activity. “Reduce API latency 40%” beats “ship 10 features.”
- Track leading indicators: Code review time, WIP limits, and meeting load predict future problems before they impact delivery.
- AI assists but does not replace judgment: 90% of developers use AI tools, but human managers remain essential for interpretation, coaching, and fair evaluation.
Frequently Asked Questions
How often should engineering managers hold performance check-ins?
Weekly 15-minute pulse checks for priorities and blockers, monthly 30-minute development discussions for growth, and quarterly goal alignment sessions for objective-setting. This cadence replaces annual reviews with continuous feedback while respecting manager time.
What are the most important metrics for engineering team performance?
The DORA metrics—deployment frequency, lead time for changes, change failure rate, failed deployment recovery time, and rework rate—provide the strongest predictors of software delivery performance. Supplement with SPACE Framework dimensions (Satisfaction, Performance, Activity, Communication, Efficiency) for holistic visibility.
Should individual developer metrics like lines of code be used in performance reviews?
No. Individual activity metrics create perverse incentives and misalign with how software engineering actually works. A developer who deletes 200 lines to simplify systems outperforms one who writes 500 lines introducing bugs. Measure team outcomes, not individual output.
How do we transition from annual reviews to continuous feedback?
Start with manager training on coaching conversations. Implement weekly 1:1s with structured agendas. Separate compensation decisions into a distinct process. Communicate the “why” transparently to engineers. Expect a 6-12 month transition period as culture shifts.
What is the rework rate metric and why did DORA add it in 2025?
Rework rate measures unplanned deployments requiring immediate fixes. DORA added it because AI coding tools have increased deployment speed without always increasing quality. It captures the hidden cost of shipping fast without proper validation—teams with high rework rates are essentially running in circles.
How can engineering teams maintain fairness in performance evaluation?
Use calibration sessions where managers align standards across teams. Focus on observable behaviors and specific outcomes rather than vague impressions. Watch for bias patterns affecting remote workers or underrepresented groups. Consider eliminating ratings entirely in favor of qualitative developmental feedback.
Sources
- Google DORA — State of DevOps Report 2025: State of AI-assisted Software Development (2025)
- LinearB — SPACE Metrics Framework for Developers Explained (2025 Edition) (2025)
- Plandek — DORA Metrics in the Age of AI: How Engineering Leaders Should Measure Delivery in 2025 (2025)
- TechClass — Continuous Feedback vs Annual Performance Reviews: Which Works Better? (2025)
- Reclaim.ai — Productivity Trends Report: One-on-One Meeting Statistics (2025)
- Gallup — Fast Feedback Fuels Performance (2024)
- Harvard Business Review — The Performance Management Revolution (2016)
- Amazing Workplaces — Adobe’s Check-In: The Future of Performance Reviews (2023)
- Hivel — What are SPACE Metrics? 2025 Guide in the Era of AI Coding (2025)
- DevDynamics — Engineering Managers’ Guide to Performance Reviews in 2025 (2025)
- Worxmate — OKR for Software Engineers: Best Practices & Examples 2025 (2025)
- Pluralsight — Effective 1:1 Meetings with Your Engineering Team: Best Practices (2024)